 Written by ContentPowered.com
 Everyone knows about using Google Analytics, for the powerful information it provides about the behavior of users on your website. Did you know Facebook offers very similar analysis for Facebook Pages, along with the optional implementation on your website as well? In fact, Facebook offers some very valuable statistics you won’t find anywhere else. When you’re digging deep into how to optimize your posts on the social media site, you’ll find no better resource. The only question is; how do you make use of the wealth of information? What should you pay attention to, and how can you make use of what you find?
1. Record and Use Audience Demographics
On Facebook, you’re not particularly interested in the time spent on page, like you would be with your website. You don’t much care if users scroll through your news feed; if they don’t engage while they’re there, they aren’t doing anything beneficial. Instead, you can track who they are and what they do while they’re on your page, for however brief and amount of time that may be.
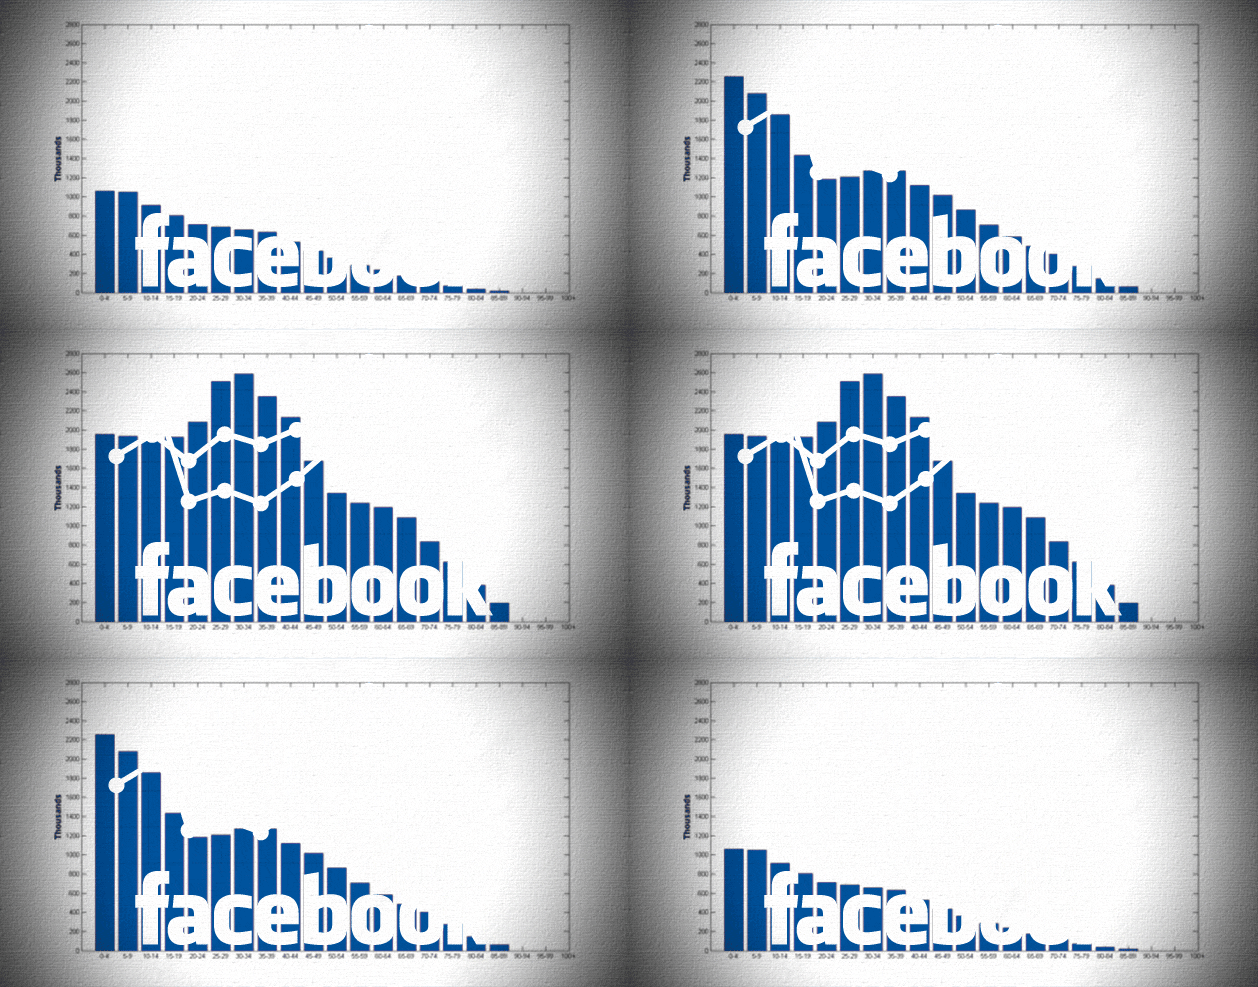
Facebook Insights shows you, for example, a quick and easy graph showing the age and gender distribution of your Facebook Page. You can answer questions such as:
- Are more women than men interested in your page?
- Do your male users comment more than your female users?
- Do your shares primarily come from people older than 35?
While you’re at it, Facebook also shows location information. Chances are, if you’re a local business, you know more or less where your audience is coming from. If you’re not a local business – either because you’ve established a national presence or you’re a web-based company – it may be much more valuable to know where your users are coming from. If, for example, you find you have an astonishingly large following in Omaha, Nebraska, perhaps you should investigate to find out why.
You have two choices when you’re looking at this kind of information. Do you take steps to encourage your current users, or do you take steps to target the lower demographics? For example, if your page is primarily used by women, do you adopt a feminist perspective and push a primarily female agenda, or do you work to target men and broaden your userbase with more generally-applicable content?
2. Monitor Post Engagement
One of the most useful statistics Facebook shows is the reach and engagement for every post. Essentially, it gives you two valuable statistics you need to watch.
- The reach of a given post.
- The number of times that post was liked, shared and commented on.
Now, these numbers are important individually. You want to increase the reach of your posts, so more users can see them. More users means more engagement, which in turn means more clicks and eventual conversions.
Like and share numbers are a bit more complex. It’s nice to know when a post has a high level of engagement, as measured by these metrics. However, any post with a high reach is going to have higher engagement numbers than a post with lower reach. What you need to do is apply a little math. Take the number of engaged users and divide it with the number of reached users. This gives you a simple ratio you can use to compare post to post.
With this number – and the related clickthrough rate number – you can determine what content performs best, and thus what content you should focus on producing. If, for example, you produce an infographic that brings in a high ratio of shares for its reach, you know that infographics perform very well on Facebook. Then, if you write and share a blog post, that post might not receive many shares. If you’re looking for engagement on Facebook, you would be better off making more infographics. On the other hand, the blog post link has a much higher click rate than your infographic; it funnels more users to your site. If you’re trying to build an audience at home, blog posts would be the way to go.
3. Monitor Click Rates
In that same window, with reach and engagement statistics, you see an indicator of the number of clicks a post receives. It’s going to be larger than the likes/shares/comments number in almost every case.
As mentioned above, you can use this statistic – when put in a ratio with reach – to create an objective comparison between any number of posts. Again, you can see which posts encourage the highest number of clicks through to your site. If that’s your goal, those are the sorts of posts you want to encourage.
This can be used for more than just content types, as well. You can compare between infographics and blog posts, or between blog posts and videos, yes. You can also compare, amongst blog posts, which subjects have the highest engagement or clickthrough rates.
As an added benefit, you can use Google Analytics on your own website to compare the number of users coming in from Facebook with the number of new conversions. You can further enhance this analysis by making use of UTM parameters or the Facebook tracking pixel, for more advanced monitoring. While you’re at it, you can make use of tracking cookies and ad retargeting, to catch the Facebook clicks that don’t convert.
4. Use the Information to Optimize Posts
All of this has been designed to get you to a point where you have a stock of useful numbers to analyze. You can, at a glance, determine which post types are best for what purpose. Consider that you have two primary purposes with Facebook; engagement on the platform, and conversions on your site. Some posts will naturally be better at one than another.
Likewise, some posts will be better at attracting certain user demographics than others. If you’re looking to expand your demographics into new audiences, you’ll need to see which posts attract the users you want to bring in. Conversely, to keep and expand your current audience demographics, you need to focus on posts they prefer.
Putting all of this to use will allow you to create a content strategy for your Facebook Page. You can, for example, create three blog posts with images per week for sharing, two targeting your current audience and one working to broaden your audience. You can supplement that with two video or graphic posts designed to encourage discussion and engagement on your page. The goal here is to build a robust and varied schedule, not to put all of your effort into one particular segment of your audience.
5. Selectively Boost Posts
A minor addition to the Facebook Insights control panel is the ability to boost and promote your posts. Some of your posts will be clear frontrunners for whatever purpose you’ve designed them; engagement or clicks. If a post is performing ahead of the curve, consider promoting it to force it into an even wider audience. This further expands its reach, which – if the ratio holds true – will increase whichever metric you’re working on. However, since boosting a post costs money, you’ll want to be very selective with the posts you promote.


