Written by ContentPowered.com
Simple question, simple answer.
- Click on the Insights button at the top of your page. You had to know that if there was a way to do this, it’d be in Insights, right?
- Click the “Likes” section. Seems fairly obvious in retrospect.
- Scroll down until you find the “Where Your Page Likes Came From” section.
If your page has under 30 users, you won’t be able to access the Insights panel. Of course, at that point you don’t have much use for insights; the statistical sample size is too small, the data you get wouldn’t be meaningful.
There’s actually a lot of cool data you can get from the Likes section of your Insights panel. Let’s do an overview.
Like Insights
First of all, you have your top navigation bar. This allows you to click between your general overview, the Likes section, a section about the reach of your posts, data about the people talking about your page, and your check-ins.
Within the Likes section, you have a date selector, so you can choose to look up data for any specific date range you’re curious about. This can be useful to see how your demographics have changed over time, as well as giving you information about a traffic spike. You don’t want to check a surge in likes only to find all of the users coming from Vietnam, eh?
Over in the upper right corner, you have two buttons. One is obvious; the export data button allows you to export your data. You can choose to get it in XLS or CSV format for use in other programs. You can also export it for specific date ranges, or at a page level or individual post level.
Next to that button is the general settings button, that isn’t super useful in Insights. It allows you to take a tour of the page if you don’t know what’s what, as well as giving you a quick link to the Help Center. You can also use this to send feedback to Facebook about their page, if you have something to say.
In the actual meat of the data, you have a big fancy graph. It has age-segmented columns situated around a center line, rising above and falling below that center line. On one side, above, is females; below is males. This is the easiest way for Facebook to present this data, though their slew of gender options makes this a lot harder to display accurately.
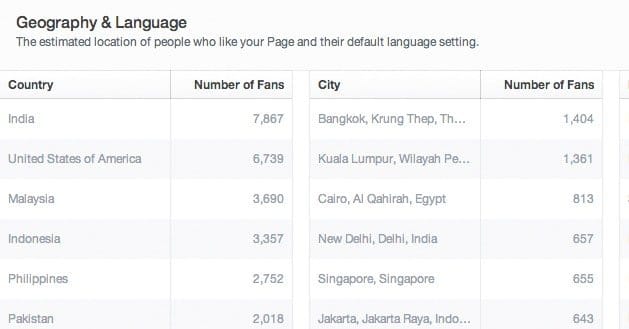
Below that data, you have three columns of numerical data. You can see your fans divided by country of origin. If you’ve been advertising organically and growing naturally, you’ll have a large portion of users in the United States, Canada, the United Kingdom, and possibly Australia. If you’ve been hit by clickfarms or you’ve bought likes from shady sellers, you’ll probably see countries like India, Indonesia, Bangladesh, Turkey and Pakistan in the list near the top. If any of these countries has taken the number one position, you may have a problem on your hands.
Next to the country data is the city data, which operates in much the same way. Next to that is language spoken by your users – or at least, language set on Facebook. A user who uses English Facebook but posts in Spanish will still count as English. Note that this also differentiates between English (US) and English (UK), as well as French and French Canadian, and other language divides.
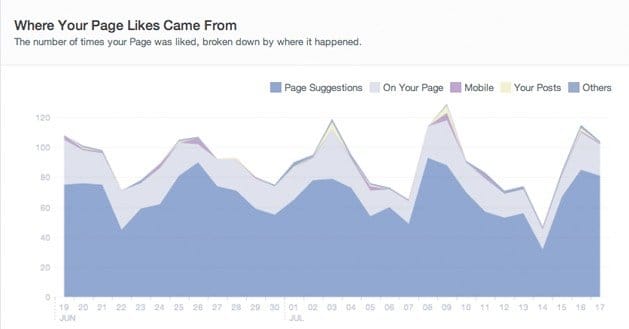
Scroll down and you see the “where your likes came from” section. This has a graph on the left, which you can check to see both new likes and unlikes. Next to that is a column of numerical data with the number of likes and the source of those likes. This is regulated by the date range all the way at the top, so make sure to set the date for the time you want to check.
What sort of like data does Facebook save for this? It’s surprisingly granular. You have large categories like “mobile” which include everyone who liked your page using a mobile device. This will probably be the highest number, simply due to how many people use Facebook for mobile.
You also have categories like Timeline, Ads and API. Timeline and Ads are self-explanatory, and API just means anyone who liked your page from a third party app.
Then you have more granular sources, like Search, Ticker, and Wizard. These, respectively, show people who liked your page from the search function, people who liked y our page from a story they saw in the ticker, and people who liked your page based on new user suggestions.
This isn’t even a complete list. You can find a more complete list here, but even that isn’t a fully complete list.
Why might you want to see all this information?
Well, for one thing, it’s a neat curiosity. As I mentioned, the largest category is probably going to be mobile, just because it’s such a larger and more over-arching category than many of the others. Beneath it, though, it’s more of a no-man’s-land of any category that comes up. You might be surprised at where some of your likes come from. Who would have thought that the new user recommendation was as effective as it is, eh?
You can also use this as a measurement of how effective certain actions you take may be. For example, say you want to implement a Facebook Like Box on your website. You do so, and you’re curious how well it works. Check this bit of Insights to see how many people like through the “external-connect” source, which measures that sort of plugin.
Consider another example; running an ad campaign for page likes. This is a specific like source in Insights, so if your campaign is reasonably successful, you’ll be able to see it in this section. You’ll also be able to see how many of those people go back and unlike your page shortly after, which is a sign that something isn’t appealing to those users.
Really, it call just comes down to your creativity and how many uses you can find for the esoteric and highly granular data Facebook provides.