 Written by ContentPowered.com
The success of a Facebook page depends on pulling in a constant supply of new users, a growing audience to help boost your business higher and higher with every passing month. It’s not enough to just attain a milestone and rest.
It’s not often talked about, but audiences have a natural decay.
Over time, some users leave, others grow disinterested, and some are banned. Some even die, as much as we don’t like to think about it. You need a certain level of growth just to “break even” in this situation, and more growth than that to see actual returns on your business.
A large part of successful growth on Facebook is knowledge. Knowledge really is power, when it’s the difference between a successful ad campaign and a failed money sink. Knowing your audience, who they are and where they come from, that’s the most important thing you can do for your Facebook page.
Thankfully, there’s a good way to learn all about your audience; Facebook Insights. Before we begin, though, you need to know that Insights is only as good as your audience. If you’ve been buying followers, your demographics are going to be skewed. If you’ve been dumping money into targeting the wrong audience, you’ll have slow growth, and you won’t necessarily know better. That’s why testing different audiences and ads is so important.
A Breakdown of Facebook Insights
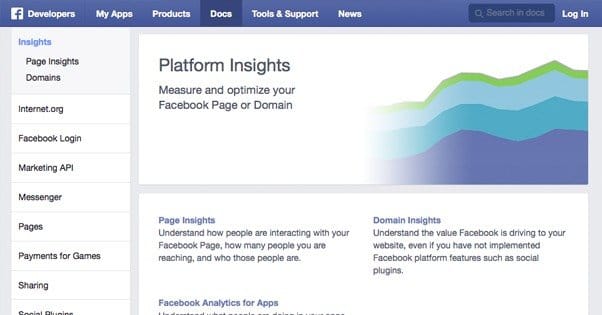
Facebook Insights is the built-in analytics software Facebook uses to allow page managers access to data about their page, their performance, their audience, and their posts. You can see a lot there, ranging from the demographics of your audience to the reach of your posts. What I’m going to cover is just your Likes, but you should explore more of the system; there’s so much more to see.
First thing to note is that you can’t see Insights on a brand new page. You need to have at least 30 fans before the Insights option will appear. No testing with a dummy account; you need to have the real thing. I can only assume this is a limit on Facebook’s part to minimize the amount of data tracking and management they need to do for otherwise empty pages.
Locating the Insights Panel
To get to the Insights panel, you need to be logged in as a page. If you’re logged in as a personal user, you’ll need to click the little drop down in the upper right and select your page instead. From there, visit your page itself. There will be a line graph admin panel above your cover photo, with the label Insights. Click it.
Once in the Insights, you’ll be on the overview page. You can feel free to poke around there. Once you’re ready to proceed and learn more about your users and where they come from, click the “likes” tab in the top bar of Insights.
Now, let’s talk about the information you see on this page. At the very top are the tab labels – Overview, Likes, Reach, etc – which take you to tabs full of information. We’re only concerned with one right now, but the others are all equally valuable in their own ways. I highly recommend digging into them at some point.
Beneath the top bar is a date field with an arrow. By default, this typically displays the last month, give or take, of data. Clicking the arrow will go back a month, or you can set any custom date range you could desire. If you want to look at all of your likes in general, set a start date of when you founded your page, and the end date today. This can give you a skewed idea of your audience, particularly if your demographics have shifted over the last few years. I might recommend sticking with the last month, the last 90 days, or the last year worth of data for a more accurate representation of your current performance.
To the right, horizontally aligned from the date field, is an export button. You can export a lot of your Facebook data, though it’s not feasible to use some of it. You can get an XLS or a CSV file, and you can get your data on the page level or on the post level, with all the date customization above. My biggest gripe with this, unfortunately, is that you can’t use it to export your users and scan through them looking for fakes. If you could, it would be much easier to keep your audience pruned to just the real followers. More on that near the end of this post.
The gear icon to the right of the export data button is your settings tab. It has a bunch of options, including a quick link to the Facebook help center, a general Insights tutorial and tour, and a feedback form for Facebook.
Digging Through the Data
Now let’s get to the actual data.
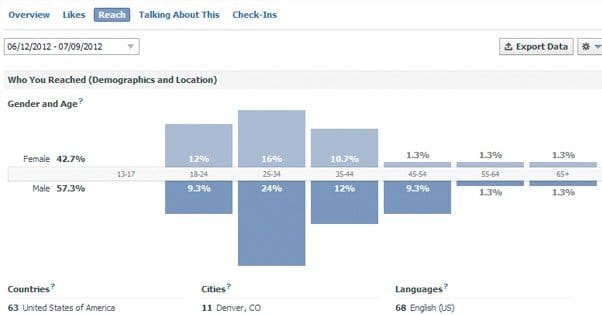
The first thing you’ll see is the large blue double bar graph centered in the screen. This is a really interesting visual representation of two pieces of data about your audience; gender and age. The center line is the labels. Above the center line are females, with percentages for each age range. Beneath the line are the males in the same age brackets. This is a very fast and easy way to see whether your audience skews significantly to one gender or the other, or if it’s primarily in a certain age range.
Facebook being Facebook, chances are that the majority of your audience is going to be in the 16-24 and 25-34 age brackets, just because those are the heaviest users of Facebook in the first place. Gender differences will tend to depend on your business; “manly” businesses tend to skew more male, while “feminine” businesses skew female. You may be surprised at how even they are, though, unless you’ve spent a long time with one-sided advertising.
One thing to note about gender on Facebook is that it’s not all tracked perfectly. This bar graph, and indeed Insights in general, only has male and female. Meanwhile, on the user end of things, Facebook has 56 total gender options, many of which are nearly duplicates or with very fine differentiations.
It’s kind of disingenuous of Facebook to allow all of these options, but not use them in Insights, but I can see why they did it. Doubtless much of their code for ads and audiences relies on the traditional two-gender dichotomy. To change that would be a massive overhaul. And, well, for every case where a genderqueer individual complains that they’re labeled Male or Female in the back end, there’s likely a case where a malicious organization or individual is prevented from making offensive ads targeting gender minorities. This isn’t the time or place to get deeper into gender politics, though, so moving on.
Next, you will see three columns, with a “show more” button at the bottom. These three are labeled Countries, Cities, and Languages. They tell you how many of your followers come from, respectively, which countries, which cities, and speak which languages. That’s obvious enough, right?
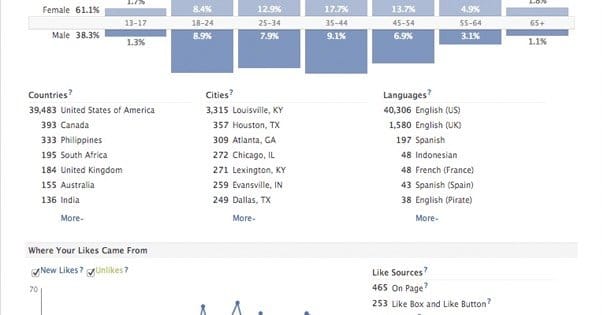
I’ll talk about this more later, but this is one way you can get an idea of how many followers you have that aren’t doing you any good. When you see countries like Egypt, Indonesia, Bangladesh, Pakistan, Turkey and Malaysia on your list, you have to wonder; what are they doing there?
For a global company like Coca-Cola, sure, I can see these countries being represented. For a small business based out of Utah, though, I doubt you’re selling much to residents of Cairo. That’s not to say you aren’t, of course. If you have a digital product and you can sell globally, by all means, encourage a global audience. Just be careful. Again, I’ll talk more about fake fans later.
Language, by the way, is just the language your users have set as their native language in Facebook. That means, for example, you might see a spike in users of English (Pirate) on Talk Like A Pirate Day. Just because a lot of users have French set as their primary doesn’t mean those users don’t know English.
In the lower section is a label “Where Your Likes Came From” with two sections. On the left is a line graph with two lines, including check boxes. These are day to day representations of how many people liked your page and how many unliked it. This is going to be a rocky, up and down graph. You would like the likes section to be going up and the unlikes to stay low, but that virtually never happens in practice. That’s because it’s raw numbers, not growth trends. You’ll see spikes when you make good viral posts or start new ad campaigns, primarily.
Each node, each day, in the line graph, is a data point. You can hold your mouse over them to find out more about each day individually.
Individual Like Sources
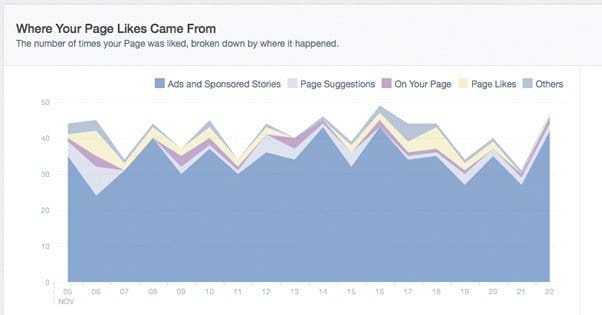
The final section, next to the line graph, is the Like Sources. You can click around and find a more detailed graph of this, but the raw numbers are available right on the likes section home.
There are a whole bunch of different possible like sources, so I’ll go over them quickly here.
- Page Suggestion – These are users who liked your page based on an invite from a page admin. When you first start a page and invite all your friends, anyone who joins through that link will show up with this source.
- Timeline – These are users who liked your page based on the likes section of either their own news feed or someone else’s news feed.
- Ads – These are users who clicked “like” on one of your ads or sponsored stories, when you use the “page likes” objective.
- Registration – These are the people you manually added to your page as a page moderator or admin, who may or may not have formerly had any association with the page.
- Mobile – These will be your most dominant source of likes; people who liked your page from a mobile device, regardless of the source of that like on the mobile device.
- Wizard Suggestion – These are the people who liked your page because of voices in their head that claim to be Gandalf. Sorry, that’s not true. These are people who like your page based on suggested pages they see when they first register for Facebook. Yes, believe it or not, people are still registering for Facebook.
- Profile Connect – These are people who liked your page from the button on the page itself, or from a news feed story that wasn’t an ad.
- External Connect – These are people who liked your page by clicking a social media button on an external website, including Facebook like boxes.
- Recommended Pages – These are people who liked your page based on the “Recommended pages” section in the Facebook sidebar.
- Favorites – These are not users, but rather other pages, that have liked your page.
- API – These are users who liked your page through a third party app, one that uses the Facebook API.
- Page Browser – These are people who liked your page while using Facebook’s built-in Page Browser. Don’t know what that is? It’s this thing.
- Hovercard – The Facebook hovercard is that thing that pops up to show a preview of a page when you mouse over a link to that page. If someone liked from that preview, it counts here.
- Search – These people liked your page based on seeing it in the search results.
- Page Profile – These are people who actually went to your page itself to like it. I know, shocking, right?
- Ticker – Not to be confused with a scrolling ticker like every other ticker on the Internet, the Facebook ticker is the list of events in the upper right corner of a profile. You may need to click expand to even see it. Anyone who liked your page through it will show up with this source.
- Like Story – Whenever someone likes your page, their friends have a chance to see a story that X liked Your Page. If they do, and they also like your page, this is the source listed.
A little long, but there you have it; all of the sources and what they mean.
Comparing Assumptions and Reality
In marketing, we often say you need to know your audience. This process often involves creating a set of customer personas, weird digital scarecrows rigged up with the averaged demographics of your audience. You use these mannequins as a fantasy focus group to gain approval for your marketing. You put yourself in their shoes, roleplay their interests, and figure out if you’re on the right track based on their input. It’s an oddly self-contained system in many ways.
What you can do with Insights is compare your personas with your actual audience data. You can ask yourself questions like “Where are my personas from, and where are my actual followers located?” Use your data to test your assumptions, and use your new data to create new messages to appeal to more accurate personas.
What Matters Beyond Likes
The raw number of likes on your page can be a reasonable indicator of popularity, but they only go so far. At some point, you need to be concerned about the quality of your fans. This is where all the discussion about fake fans comes in.
Fake fans are detrimental to your page. For one thing, they never buy your products. I mean, sure, a lot of your followers won’t convert right away, but they might convert eventually, or they at least support you by sharing your posts. Fake followers don’t do that. They exist solely to like pages. They don’t buy products, they don’t share posts, they don’t leave comments, or anything else.
A lot of what makes a fan fake is context. Bot accounts are actually somewhat rare. The real problem is accounts run by real people in developing nations, typically people who are paid a few pennies per like or ad click, and just keep their activity up to make their accounts look realistic. When Facebook purges accounts, these accounts tend to be targeted.
So, real accounts are typically at least in the same country as your business, and they do things like comment, like, share, and click links. They convert. Fake users don’t do that. What do they look like?
Hallmarks of Fake Followers
The number one indicator tends to be geographic location. Remember that list of countries I mentioned above? Countries like India, Pakistan, Bangladesh, Turkey, and Malaysia? It’s rare to find legitimate users coming from these countries. However, they do exist, so you can’t just blindly remove anyone from a country you don’t like.
Fake users also rarely post to their accounts. 99% of their activity is liking pages. They may not have cover photos or profile pictures, or if they do, those images are often found frequently elsewhere. You can search by image with Google, and you’ll often find the same picture used in a dozen different locations, or more if it’s a stock photo.
Insights gives you a chance to look at your followers and identify if you have a problem with fake followers. If, for example, Bangladesh is in the top 3 sources for your followers, you’re probably being targeted.
Removing Fake Fans
Unfortunately, there’s no good way to audit your followers in bulk You can click your fans icon and see recent fans, and if any of them appear to be fake, you can remove them from your page from there. The problem is, this only goes back for so long. Sooner or later, Facebook will stop providing more names for the list, no matter how much you try to keep expanding it.
You can also go into your page management and click activity. You can filter activity by type, and one type is “Likes.” There you can, again, see a readout of most of your recent activity. It doesn’t stretch back infinitely, though, so at some point you run into a wall.
The only saving grace about this is that often Facebook has purged most of the oldest fake accounts. A lot of your oldest followers might not be active, or they might not be engaged, but they’re at least real people. Sometimes, that’s all you can ask for.