 Written by ContentPowered.com
Facebook is a huge traffic center for a lot of businesses, and as such, you might expect the ability to track information about it similar to how you track your own website using something like Google Analytics.
You can’t install Google Analytics on Facebook, but you’re not completely out of luck. Facebook Insights, specifically Page Insights, can give you a lot of the information you want to see.
What is Facebook Insights?
In case you’re not a frequent reader of marketing blogs, or if you’ve somehow missed this, it’s easy to cover. Facebook Insights is the built-in Facebook analytics platform. Similar to Google Analytics, it covers a wide range of data, both about your Facebook page and about your website. However, in order to track data from your website, you need to install Facebook’s tracking code, known as the tracking pixel, on the pages you want to track.
Facebook’s website tracking is not as robust as Google’s, but that’s because it doesn’t have to be. It exists primarily for two purposes. One is to see the behaviors of users who click from your Facebook page to your website. The other is to track ad performance and ad conversions. I’m not going to be talking about ads today, but you can find plenty of information about tracking them on this site, on Facebook, and throughout a number of other marketing sites.
How to Find Facebook Insights
Finding your Facebook Insights panel is very easy. First, make sure you’re logged in as an account that has admin, editor, moderator, advertiser, or analyst roles for your page. This is all of the available roles, but it’s a valid point, because no one outside of your administration team is able to see your Insights. You can’t go view the insights panel for any other business, either.
Once you’re logged in, navigate to your page. You can visit your URL directly, find a post made by your page and click through to the profile, or simply click the down arrow in the upper right corner and choose the appropriate page.
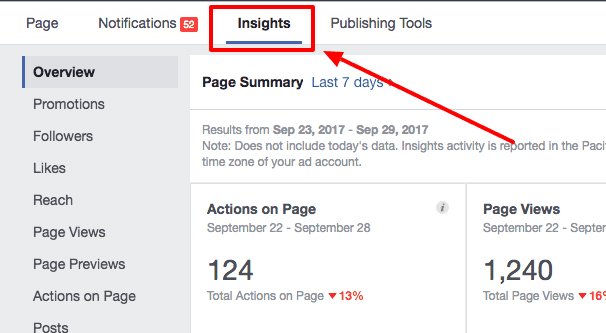
You will be on the page role view for your page, whatever that role is. Up at the top of the page, above the cover photo but below the blue banner bar for Facebook’s search and navigation, you will see a white strip with options on it. One of those options is Insights. Click it to be taken to your main Insights panel.
Finding View Sources
Once you’re in Facebook Insights, chances are you want to see where your views are coming from. If you’re not familiar with analytics, it can be pretty daunting to see all of the various metrics displayed in front of you by default. There’s a lot going on, so let’s find what you’re looking for first.
First of all, ignore the main panel with all of your summary data. This is very useful stuff, but it’s not something you really need to worry about when you’re looking for the source of your page views. Instead, look at the column to the left. You’ll see entries like Overview, Promotions, Followers, and so on. About six down you will see Page Views. Click on this option.
This will change the main pane of your view to the Page Views panel. This is divided up into four different sections. The top section is a graph showing your page views over time. By default this shows you the current week. You can click one of the handy links to view the past month, the past quarter, or specify a start and end date. You can also drag the sliders to adjust the graph.
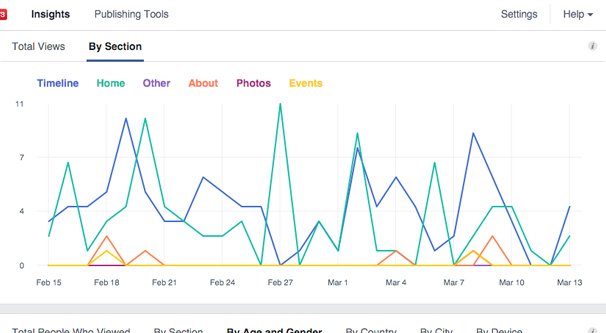
The second section is your total page views, again in a graph. This shows both people who are logged in and who are logged out, and it just counts views; it is not filtered in any way. You can choose to separate it by section instead if you prefer. This will divide your views up by sections like Jobs, Live Videos, Locations, Music, and Custom. They are all nicely color coded, and you can use this to identify what content on your page is getting the most views.
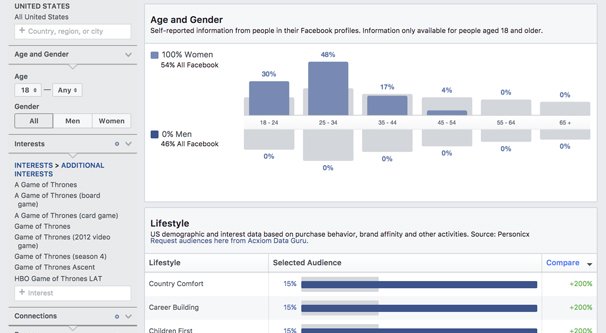
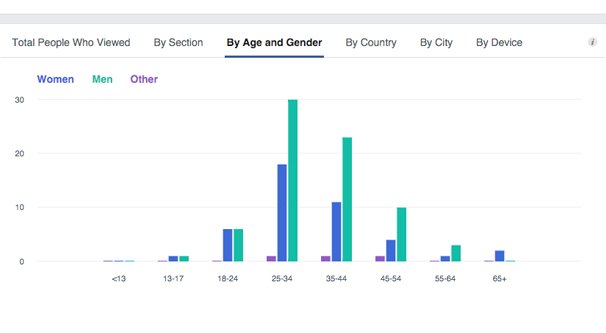
The third section is a division of your demographics. The main chart is the total number of people who are logged in and have viewed your page. Logged out users are not counted in this section. You can divide this by different categories as well. You can view your views by section, by age and gender distribution, by country of origin, by city, and even by device type, though it only divides between desktop and mobile devices. All charts other than totals or by section require you to choose a 7-28 day period to view; shorter and longer time spans cannot be viewed.
Finally, you have the fourth section, which is your Top Sources. This is a series of line graphs showing your top traffic sources for your chosen period of time.
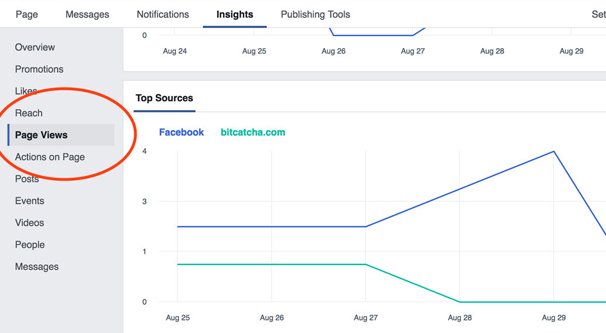
In general, your top three for these traffic sources are likely to be Google, Facebook, and your website. However, you can use this for two purposes. First, you can check to see if there are any unexpectedly high sources of referral traffic to your Facebook page. Maybe your posts were embedded in a blog post illustrating something, good or bad. Maybe you had a particularly good video on YouTube that links to your Facebook page. Who knows! You can find out in Insights.
The second use for this is to see if a specific ad campaign you’re running is doing well. Say you paid for a sponsored post on a high profile news blog. You can check this section to see if you have views coming in from that blog, and if so, how the quantity stacks up against other traffic sources.
Facebook Attribution
Facebook recently started rolling out a new tool called the Facebook Attribution Tool. This tool, formerly known as Atlas, was once limited to only huge, high profile advertisers. It has now been expanded to any advertiser.
In order to use the Facebook Attribution tool, you need to use the Facebook Business Manager. Business Manager is a formalized platform for businesses to use Facebook through a less distraction-filled platform. It also provides a bunch of extra features for people running pages. We’ve covered some of the basics over here.
In order to use Attribution, you will need to set it up first. You will need to choose how your business is organized, which can be a complicated choice. Are you a single business? One brand with several verticals? Multiple brands? One brand spread over individual geographic regions? An agency operating Facebook for numerous brands? Pick the one that works best for you.
From here, you need to add in your various ad and data sources. This will include any Facebook-based advertising accounts linked up to your business manager, as well as various pixels, apps, and offline event selections. You will also need to add in basic configuration options, like currency and time zone, for accuracy in your data. Once everything is set up, you should continue to the attribution tool.
At this point, you need to set up your ad flow. This is where you configure your ad platforms, which can be any source of ad traffic, within Facebook or without. Google Ads, Bing Ads, Pinterest Ads, and anything else you choose to run can all be configured here.
Note that you are not configuring how your ads run on those other platforms; this is not a centralized ad manager. Rather, you are adding sources of ad traffic that can be tracked through Facebook.
Why is this important? It’s ideal so you can see the difference between organic and paid traffic, as well as different traffic sources on the same website. You may have noticed with the traffic sources above that it lists a root domain, like Google.com, but it does not list sub-pages or sub-data. Organic Google search results, paid Google search ads, and other Google-based sources are all counted as the same source.
With the attribution tool, you have more specific attribution for your traffic sources. You will be able to see specifically where your traffic is coming from, and that will let you more accurately track your traffic.
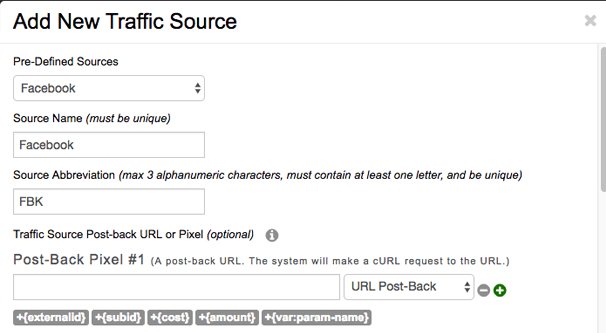
Depending on the traffic source, you may need to configure it. Some are preconfigured, through Facebook’s work with the ad network in question. Others require you to add some information, and a few are listed as “not supported” and will require you to contact the publisher manually.
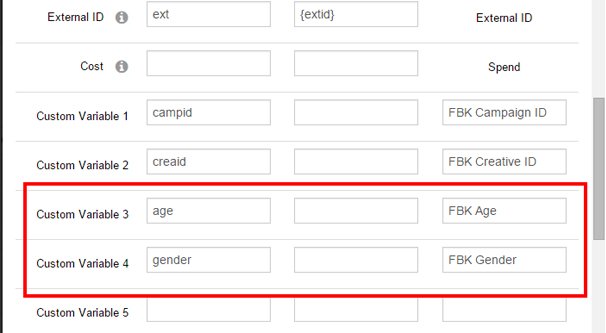
When you configure a traffic source, you will essentially need to generate the ad tag that accompanies your URL and put it into the platform configuration. This will allow Facebook to recognize which traffic is yours and attribute it properly.
Unfortunately, there’s no way for Facebook to add attribution to data retroactively. Much like Google analytics and most other analytics suites, tracking begins at the date you set it up. You will have to wait days, weeks, or even months to get enough data to rack up meaningful stats. How long it takes depends on what you want to see and how frequently that event occurs.
Top Sources of Attribution
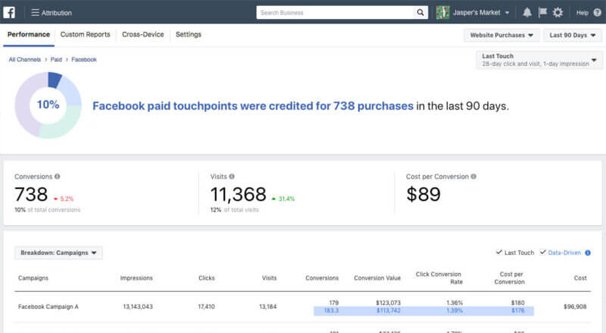
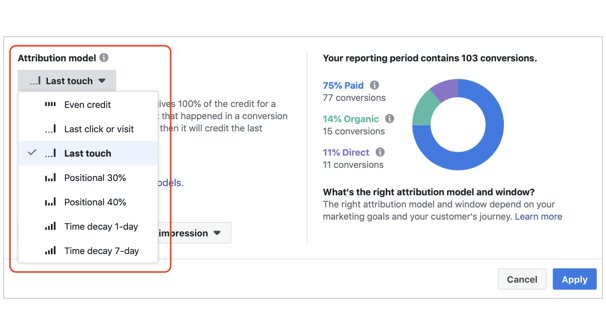
The Attribution tool can divide up your top sources of traffic in various ways. For example, it can show you the top sources of new registrations on your website, divided by the source. It will show you the source name, the channel, the number of visits and conversions, and even the conversion value, if you have a value assigned to the conversion action.
The same can be said of website purchases as well. It’s the same selection of data, except the conversion value is more likely to be something other than $0.
In order to make the best possible use out of the Facebook attribution tool, you want to add as many conversion sources as possible. Every source you use for traffic should be included. Each ad network and other social network you use should be linked, so you can track that data accurately.
Remember, however, that this only applies to paid traffic sources. You aren’t able to add organic sources, like guest post outreach that doesn’t include formalized tracking. The way Facebook is able to attribute paid versus organic traffic is by taking the total traffic and subtracting the paid traffic it recognizes, leaving the rest as organic traffic.
If you’re interested in reading more about the attribution tool – and you’re not daunted by the sheer scale of information available to you – Jon Loomer has an excellent guide where he walks you through the basics of the tool over here. He also has a specific post about top conversion sources in this post. They’re both well worth checking out if you’re into this kind of data analysis.
Remember that this is barely scratching the surface of all of the data available to you in the vanilla Insights panel, let alone the business manager system and the various tools available to you when you use it. I recommend ignoring the whole business manager section until you’re more fluent with Facebook and the way the whole platform works. If insights is daunting, you can bet business manager will be worse. That said, it’s actually a lot less daunting than it looks. It’s a lot of numbers, sure, and you might not immediately know why some of them are important, but there are a lot of resources that can help you leanr.