 Written by ContentPowered.com
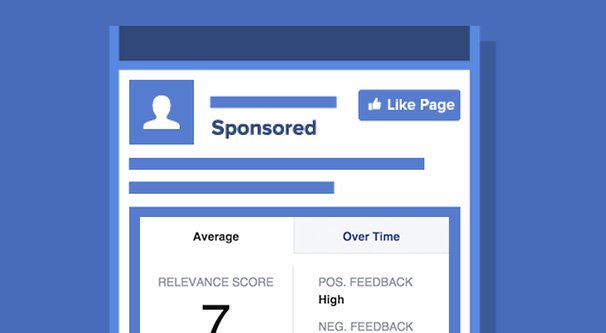
Facebook maintains something called a “relevance score” for their ads system. It’s a complex mechanic that influences a lot of moving parts, or rather, tracks them. According to an update made in September of 2018,
- “Relevance score is a reflection of ad performance, not an input to ad performance. In other words, a higher relevance score is associated with improved performance, but does not itself drive the improvement in performance.” — Facebook
The goal of relevance score is to give you as an advertiser a single concrete number you can use to estimate the performance of your ads, without calculations and without metrics. Facebook does the work for you, and you can use that number to help you improve moving forward.
Improving your relevance score does not directly affect any calculation. However, the factors that go into calculating relevance score do, so when you improve those factors, your relevance score improves as well. They may as well be tied together.
Facebook’s Notes on Relevance Score
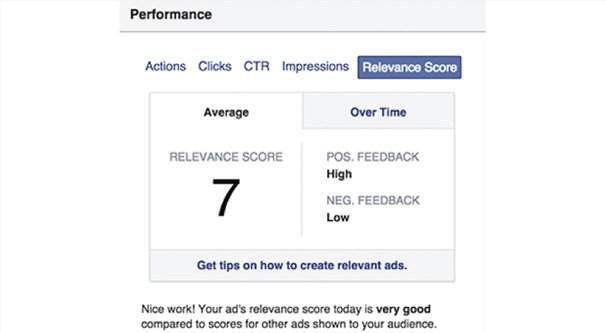
First of all, your ad relevance score is an aggregate measurement of various relevance and quality factors. It’s a number between 1 and 10. A score of 1 is bad, and means your ad is basically irrelevant to your target audience. A score of 10 means you’re spot-on with your relevance to your audience. Note that this doesn’t guarantee you the top spot on ad auctions and so on; other people can also have 10s.
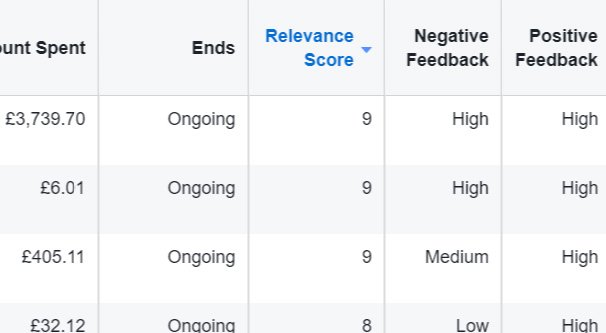
For the most part, relevance score only looks at positive and negative feedback to your ads. Negative feedback is obvious; people who report your ad or click “I don’t want to see this ad” are leaving negative feedback. An ad being ignored is not negative feedback, however.
Positive feedback is pretty much any interaction with your ad. Reactions, comments, clicks, app installs, video views, and any non-negative interaction is generally a positive interaction.
It’s also worth noting that your ads will not show a calculated relevance score until they have obtained at least 500 impressions. Data prior to that level of exposure is not statistically significant, so Facebook doesn’t bother to make the calculation.
So does relevance score affect your ad costs? Here what Facebook has to say.
- “It’s important to note that relevance score is an output, not an input. In other words, we aggregate the factors and convert them into the 1-10 scale in order to give you a general idea of your ad’s relative relevance. However, when your ad enters an auction, the 1-10 number is not part of the “total value” calculation that determines which ad gets shown.” — Facebook
While it’s usually a good idea to try to strive for a higher relevance score, it’s not imperative to do. In fact, even Facebook says that you don’t necessarily need to change anything if your ads are performing well, even if your relevance score is low. Relevance score is a metric you can watch for your own use, but other metrics – like conversion rates – are generally more important.
So, to answer the question in plain language, no, Facebook ad relevance score does not affect your ad costs. Other factors affect ad costs and can also affect relevance score, but relevance score itself is not used in any calculation.
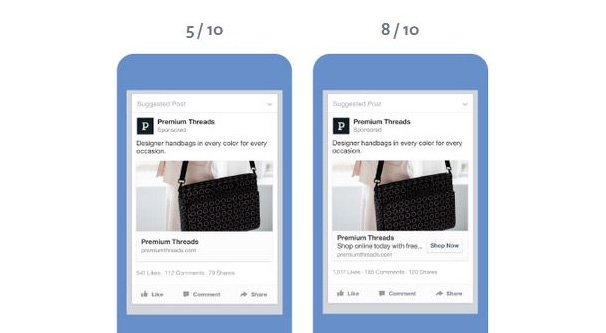
It’s also worth mentioning that ad relevance score is a comparative metric. It’s based on your target audience and the competition you have for that audience. The average, then, is 5. If your score is above 5, you are more relevant than the majority of other people targeting your audience. This means that if some competitors drop out of the race despite doing well, your relevance score can rise, despite you having done nothing different.
Improving Relevance Score
If you want to improve your relevance score for your Facebook ads, you basically just need to take actions that lead to more positive interactions and fewer negative interactions.

Here are a few tips you might consider.
- Make sure you’re targeting narrow audience segments. One broad audience with one broad ad won’t perform nearly as well as splitting the same budget between three ads targeting three different audience segments. Formulating narrow buyer personas and targeting ads at those specific kinds of people is the key to modern success with PPC ads, on Facebook especially.
- Use the interest intersection feature. This changes the “X or Y” logic for interest targeting to “X and Y”. If you know your audience is interested in both running and swimming, you can use the intersection of them for a narrow target audience, rather than putting both in and getting everyone who does running and everyone who does swimming.
- Keep an eye on your ad frequency. Ads lose their steam very quickly after reaching saturation, so an ad frequency of 1 or higher means people are starting to see your ads multiple times. Your chances of immediate conversions drop at this point, and it becomes better to retarget an audience segment based on the people who engaged the first time around.
- Try to avoid anything that will lead to users reporting or clicking “I don’t want to see this ad” on your content. Narrow targeting helps with this, as does well-done copy.
- Consider using video in your ad copy. Video is harder to produce, but it’s also inherently more compelling than static images. Plus, a video view counts as positive interactions, boosting your relevance score right out the gate.
Remember that the driving factors for ad relevance are just positive and negative actions. If your ad isn’t spurring on positive actions, you need to make it more compelling. Conversely, if your ads are causing a lot of people to hide them, you need to figure out why and fix the problem. Often this is a frequency issue, but it can also be due to offensive copy, poor targeting, or other issues.
How Should You Use Relevance Score?
At the end of the day, relevance score is just a monitor. It does not have any direct influence on anything, and an ad can perform the same with varying relevance scores just at different times.
Keep an eye on it, and note which ads have high scores and which have lower scores. Correlate this to your ad performance, and keep that in mind as you create new ads. Model new ads after older ads that had higher scores. There’s really not much else you can or need to do.
Facebook’s New Scores
Now, here’s an interesting twist to this article. Facebook, throughout 2019, is rolling out three new scores. These new scores are “ad relevance diagnostics” and are meant to help you make sense of your ads in a way that one single number never could.
You may not have these three new scores yet, and I don’t either, so I’m just reporting based on what Facebook has made public with them so far. Here’s what we know.
The first of the three new scores is Quality Ranking. Quality ranking is one of three linked metrics for ad relevance. Quality ranking is a rank of the perceived quality of your ads compared to other ads with the same audience.
Quality ranking can be Above Average, Average, Below Average, Below Average, or Below Average. Wait, what?
Each of these actually has a percentage of ads attached to it. You have Below Average (Bottom 10% of ads), Below Average (Bottom 20% of ads), Below Average (Bottom 35% of ads), Average (the 35th to 55th percentile ads) and the better ads. Yes, it’s a little confusing, but all you really need to know is that you want to strive for ads that are above average.
The second of the three new scores is Engagement Rate Ranking. This is a different dimension of ad relevance and is focused on explaining how your ad is expected to perform in terms of engagement actions. Clicks, reactions, comments, shares, and other forms of engagement are all good metrics, and this score estimates how an ad will perform.
Again, this metric has the same percentile distribution for above and below average, and it’s also a comparative metric. It ranks your ads amongst other active ads targeting the same audience set. It’s also only available on ads that have engagement as a possible action; impression ads, reach ads, and value ads – among other types – can’t get this metric.
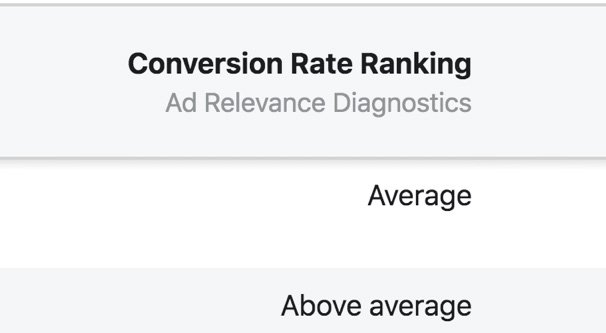
The third of the three new scores is Conversion Rate Ranking. This again has the same distribution of above and below average segmentation. It’s an expectation for the conversion rate for your ads, again compared to the same target audience.
Keep in mind, however, that a conversion rate metric compared by audience is not necessarily a valuable metric. Even Facebook acknowledges it.
- “Some products and services naturally exhibit lower conversion rates than others competing in the same ad auction. High-price or high-consideration products like jewelry should expect lower conversion rate rankings than lower-price or lower-consideration products like t-shirts.”
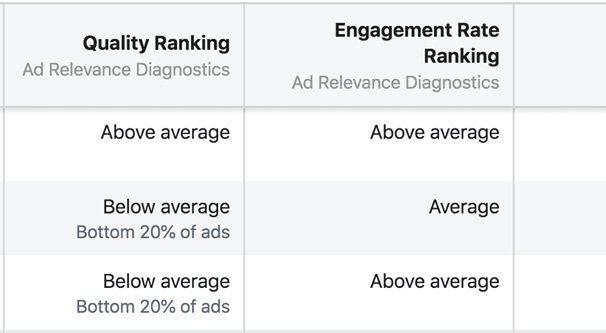
Facebook provides an interesting table with each of the possible results for each of the three metrics. I’ll go over it here, but you can read along at this link.
- If all three metrics are average or above, you’re good to go. Your ads are fine and you can optimize elements like targeting, landing pages, and bids to increase conversions.
- If only quality is below average, your ad is likely going to be perceived as low quality compared to other ads the audience sees. Try to take actions that improve the quality of your ad images, ad copy, or targeting.
- If only your conversion rate is below average, your ad just isn’t going to convert. Generally, this means you should focus on trying to either target an audience more likely to convert, or improve your call to action. This, of course, assumes you aren’t actually converting; some ads have a below average conversion rate but are still working fine, like mentioned in the quote above.
- If only the engagement rate is below average, your ad just isn’t spurring interest in your audience. You need to take action to make it more engaging, either by making it more eye-catching or by encouraging interactions. You may also want to improve targeting to reach a more interested group of people.
- If only quality is above average, you have a great at that’s targeting the wrong people. You need to figure out how to make it more engaging and capture more audience attention to convert.
- If only the conversion rate is above average, your ads aren’t very good but are working to get conversions regardless. Your ads may be just fine, but if you improve the quality of your ad copy anyway, they might work even better.
- If only your engagement rank is above average, people are engaging with your ads but not doing anything else with them. You need to improve your copy and your offer to encourage more than superficial engagement.
- If all three metrics are below average, you just have a pretty bad ad. Either figure out how to improve it in every category, or scrap it and start from the ground up again.
Keep in mind that this is all estimated and it’s all comparative. If your ads are accomplishing your goals despite lower metrics, you don’t need to change anything. You can, and you may be able to improve them if you do, but it’s not always necessary.