 Written by ContentPowered.com
![]()
Facebook is a great platform for businesses for a number of reasons. One primary reason is simply the huge number of people using the platform. Beyond that, though, the sheer wealth of information they give you to target and reach your audience is beyond compare.
Among all of the possible pieces of data you might want to see, the number of people viewing your posts is a rather simple one. There are a couple of ways you can see this and similar metrics, so let’s take a look.
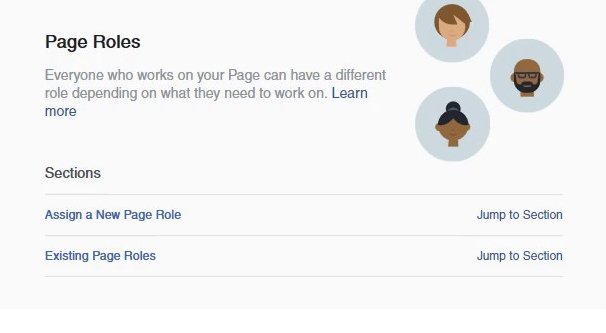
Page Roles
First up, I need to discuss page roles. Everyone who has a hand in managing your page should have an assigned role for your page. Every page role can view insights, but the other actions they can take are limited.
Analysts are able to view insights, view the page quality tab, and see who publishes as a page – that is, see which accounts are the ones creating and publishing content on the page’s feed.
Advertisers can do everything analysts can do, but are also able to create ads, promotions, and boosted posts.
Jobs Managers are able to do everything advertisers can do, but can also publish and manage job postings. Since an increasing number of businesses are turning to Facebook for hiring rather than the more corporate LinkedIn, this is a good role for someone in HR to have.
Moderators can do everything jobs managers can do except manage jobs. However, they can also remove and ban people from the page, respond to comments or delete comments and posts on the page, and can send messages as the page. Basically, they can react to communications, but they can’t present new communications.
Editors can do everything moderators can do, plus they have the job management capability as well. On top of that, they can create new posts and delete posts on the page wall, and can edit page information and the apps the page uses.
Finally, Admins are the ultimate in features, with all of the capability of editors but with the ability to manage page roles as well. Every page needs an admin, the owner of a page needs to be an admin, and admins are the most powerful role.
Every person in your organization who has a need to touch your Facebook page for any reason should have a role assigned to their own account, rather than using any kind of shared login. Shared logins have a lot of drawbacks; Facebook may block them when multiple IPs try to use them, for example, and there’s no auditing or accountability to track who does what using one shared account. Always give individuals a role that fits their duties and has no more power than is necessary to perform those duties.
Since every role can view insights, this isn’t super relevant for viewing post view counts, but it does give you an important instruction. If you have someone who wants to look into your analytics and compile reports, give them an analyst role, not an admin role.
Option 1: Post Metrics
With discussion of roles out of the way, let’s talk about how you can look up the number of views a post has. The first and easiest option is to simply look at the post on your page. When you visit your page while logged in as any role with insights capability, posts will have a bit of additional information below them. This will show two numbers: people reached and engagements.
Engagements is simply a number of times users have taken action on that post. Engagement is tricky because it is not just a simple count of reactions and comments. Engagements actually includes reactions, comments, and shares, but also link clicks, clicks through to your page itself, offer claims, event RSVPs, and even reports. Yes, even negative engagement is considered engagement for the purposes of this number.
Reach is also a tricky number. Reach is not necessarily an equivalent to the number of views a post has. Reach is the number of people who have viewed your post. If one person sees your post three times, that would be three views but only plus one reach.
Reach is also divided into three categories, though not on your page feed. On your page feed, you only see one reach number, which is your total reach. When you dig into analytics, which I will in a moment, you see reach divided into three categories.
The three flavors of reach are Organic Reach, Paid Reach, and Viral Reach. Organic reach is the number of people who see your post because it shows up in their feed naturally. These are people who follow you and who see your posts, and are generally your best users, though not always. Paid reach is, of course, the people who see your post because you paid for additional exposure on the post. Boosting a post or turning a post into an ad will increase paid reach. Any post that you are not paying to promote will have zero paid reach. Finally, viral reach is reach from a share or other engagement when a user who sees your post from one of the other kinds of reach – or from viral reach themselves – puts it in front of others. If I share a post and you see it, you are viral reach.
Facebook does not seem to currently use viral reach as a unique form of reach anymore, though now and then you’ll see a marker for it in insights or in the help center. These days, it seems like the difference between viral reach and organic reach has been removed, and both kinds are simply organic reach now.
Most of this is just informational for this method, since all you can see on a post is Reach in general. It’s the sum total of your organic and paid reach numbers, displayed in one easy to track number. If you want to see how your post does hour over hour or day over day, you can watch this number and see how it rises.
Option 2: Insights
The second option is where Facebook’s wealth of data really shines. In Facebook’s insights panel, you can see a lot of additional information. It’s easy to access, but hard to learn, because there’s so much there hidden away in dozens of different panels and filters.
To start with, navigate to your page and make sure you’re logged in as any account with a role. Analyst or up, it doesn’t matter, you’ll have access to insights so long as you’re an official page manager of some flavor.
Look at the top of the page, in the gray bar below the blue bar. You’ll see terms like Page, Inbox, Notifications, and so on. One of those is Insights; click it and you will be brought to the basic insights homepage.
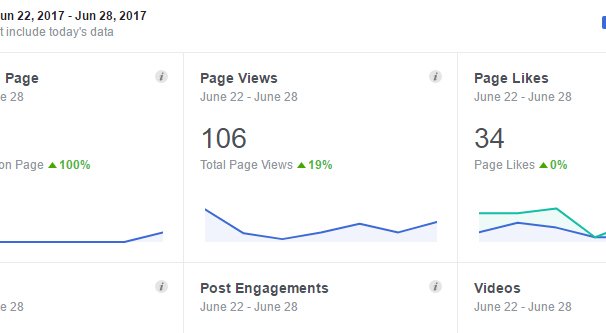
Now you have two options. The first is to look in the left-hand column and look for the entry labeled Page Views. Click on this and you will be taken to a page that shows you views on your page as a whole. You can see a graph of your views day by day, in a time period you specify up at the top.
There are a lot of filters you can apply to this section. In the top chart, you can choose the time frame. By default it’s the most recent week, but you can set the most recent month or quarter. You can also specify exact start and end dates.
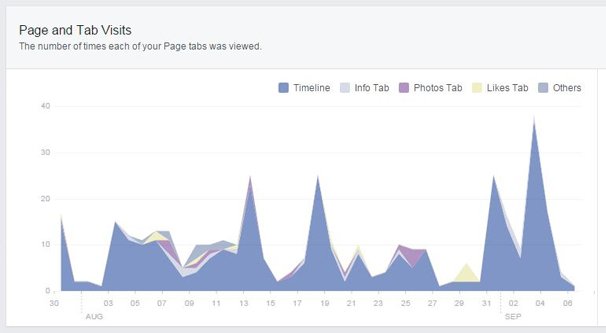
The second box with the first major chart shows you your chosen time frame and the total number of views on your page as a whole. You can click the “by section” header at the top of that box to divide up your page views by category. This will show you views separated for “other”, jobs, live videos, locations, music, and “custom”. There will be others depending on the sections you have as tabs on your page, but it’s still going to be fairly valueless unless you want to see specifically how many of your views come from videos or something.
The third box is the really valuable box. It shows you the total number of people who viewed your page as a whole, but it has better ways to divide up the data. If you choose, you can instead see the people who viewed based on section as above, or by age and gender, or by country, by city, or even by device. Finally, at the bottom, you will see a list of your top sources of views.
Now, this last graph isn’t strictly your views, it’s your viewers. It is, as explained above, more like reach than it is views. You’ll have more views than you have people who are viewing, because one person can view multiple posts or multiple sections in one visit. They will count differently for different charts.
This is where your second option comes in. Go back to the left-hand column and look further down, to where you see Posts. Click that entry.
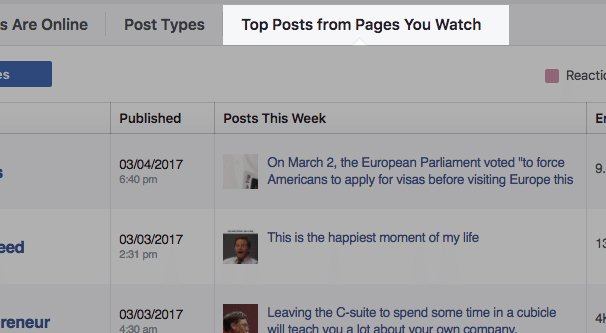
Here you will see a lot of useful data displayed in two boxes. The top box shows you when your fans are online on an hourly basis, day by day. You can change it to the Post Types heading, which will show you all of your posts within your chosen timeframe and will show you the reach, clicks, and engagement on those posts. There’s a third heading, which isn’t super useful, but I’ll explain it nonetheless.
This third heading is “top posts from pages you watch” and it requires you to set up specific pages you want to monitor. It’s basically some very low-level competitive intelligence. It can show you the basic public performance of the top posts from competitors pages, as long as you add those pages. You do have to add them, and you do have to have a use for that data, which is generally benchmarking. Remember, though, it’s not your data, so it’s not helpful for looking at your posts specifically.
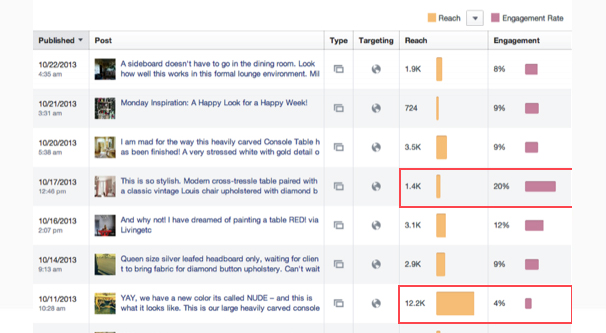
Below this whole box is a whole other box, labeled All Posts Published. This shows you all of your posts is publication order, from most recent on down. You can see the date and time the post was made, the title and thumbnail preview of the post, and the type of post. You also see targeting, if you chose specific targeting. Then you have two graphs. One is a count of your reach, and the other is two counts, for your clicks and your engagement.
Above, you can filter two parts of this data. Next to the reach box, you can see a drop-down arrow. Clicking it will allow you to change the filter on your reach counter to be reach divided by organic and paid, just reach, impressions divided by organic and paid, and reach divided by fans and non-fans.
This is useful data, in particular impressions. Impressions is much closer to the traditional view count that you may be hoping to see, rather than reach. One person can give one post multiple impressions, even while they only give it one reach. This is your best count for views.
Likewise, under the reactions, comments, and shares section, you can choose to filter it instead to ignore clicks, to show negative engagement like hides, reports, and unlikes, or you can show the engagement rate. These are, again, all useful metrics.
That’s pretty much all of the available ways to see your views for your posts, but it’s just scratching the surface of your analytics in general.